Linear Regression
I've recently begun exploring machine learning finding it rather exciting. Outside of common applications like chat-bots and LLM's like Chat-GPT, AI and machine learning is being used in fields such as biology, finance, healthcare and social media. Machine learning in simple terms is "Programming a computer to make predictions based off data". For example, say you're given data that contains the size of a city in km2 and its population.
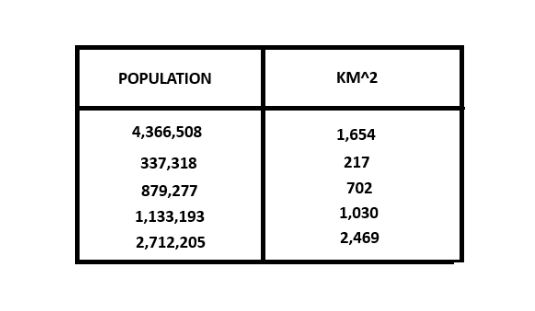
We could take this information, and use it to predict how large a city might be based off of its population. The population in this scenario is the input (x) and the area is the output (y). This is in essence our training data that we will use to train our model. If you reflect back to high-school, you may remember algebra class and more specifically this fomula:
- y = mx + b
This formula allows you to calculate the y value based off of a given x value if you have the slope and the y-intercept. I'll explain this in a little bit more detail down the line but this formula is very similar to what's used in linear regression. The biggest difference though is that in machine learning, you're calculating the predicted value and not the actual value. The formula for machine learning is:
- fw,b(x) = wx + b
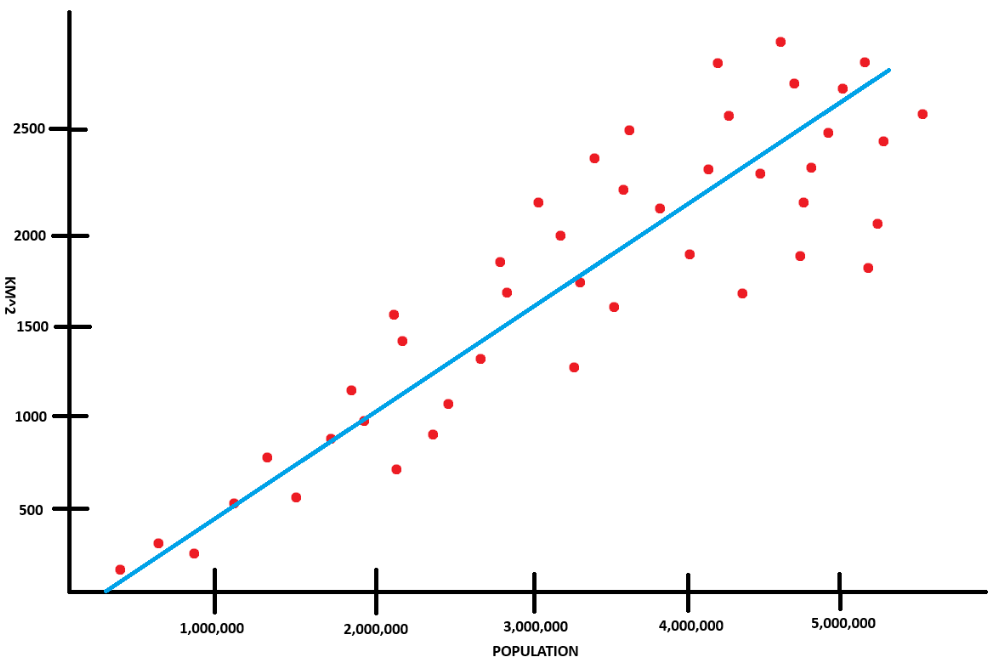
Once you take a look at the graph below, the reason we're calculating the predicted value and not the actual value becomes a little more clear. The data points aren't going to fall directly on a line if we drew one on the graph. Instead, the majority of the data-points are going to be in the general vicinity of the line that we draw.
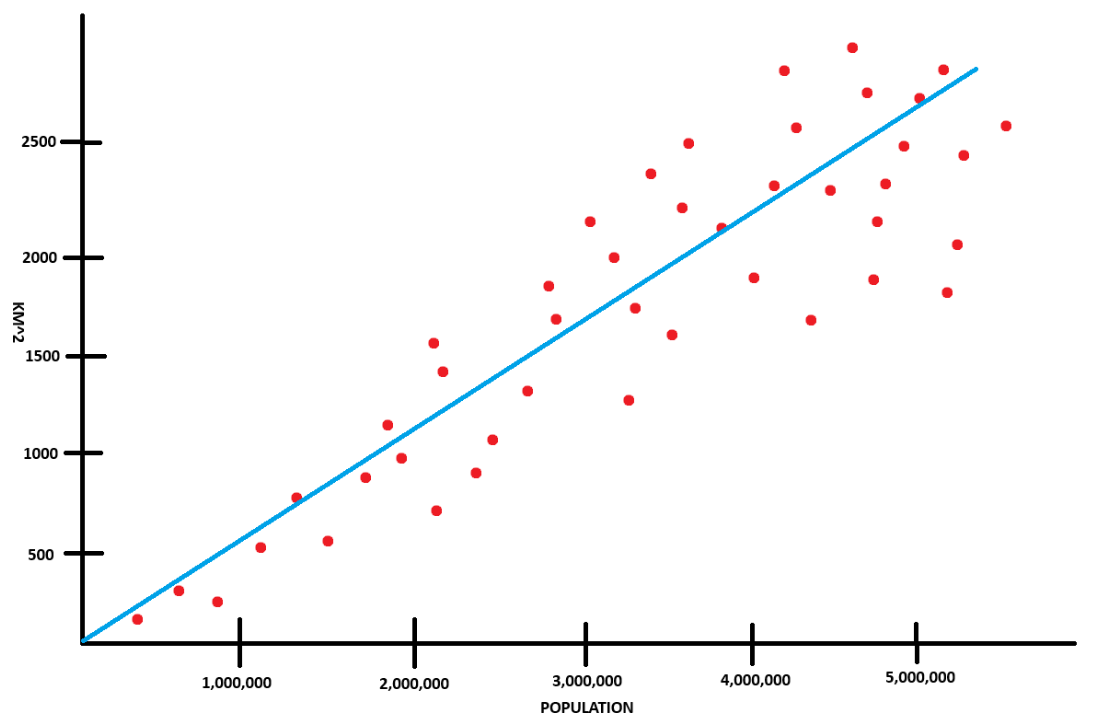
This is really important because it goes back to my initial statement of how machine learning makes predictions. Furthermore, the machine learning model is only as good as the data that we use. You could run into issues where the data is biased, lack of data, or the data is "noisy" meaning that simply put, it's all over the graph.
The formula
fw, b(x) = wx + b is the formula that we use for making predictions with our data or in other words, our model. The machine learning formula is similar to algebra's y = mx + b, however there are some slight differences between the terminology that we use. In algebra's y = mx + b:
- y: The actual output value
- m: The slope (rate of change)
- b: The y-intercept
- x: The input value
Where as in machine learning's fw, b(x) = wx + b:
- fw, b(x): The predicted output value
- w: The weight (determines the steepness of the line)
- b: The bias (adjusts the line up or down)
- x: The input feature (e.g., population)
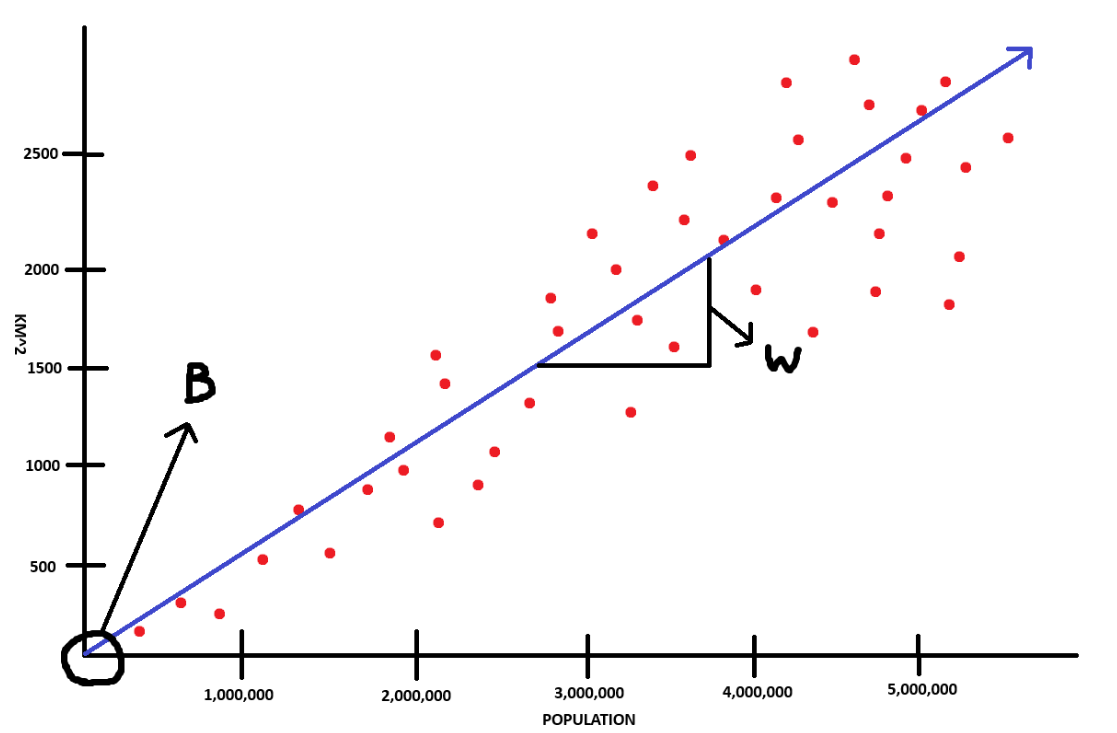
In the above graph, the bias is 0. However if the line were to intercept the y-axis at say 500 or 1000, then that would be our bias (b). As for the slope or weight, we could calculate it temporarily by eye-balling it and using rise over run: (y2 - y1) / (x2 - x1). Taking a look at the graph
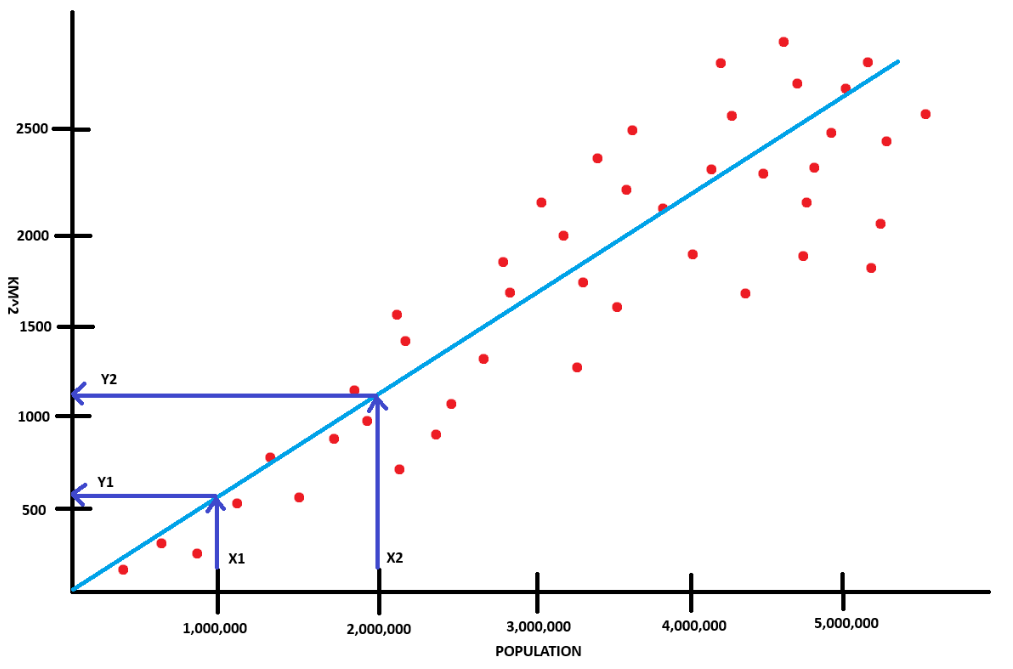
and using our nifty little rise over run formula, we could calculate the weight:
- y2: 1200
- y1: 600
- x2: 2 000 000
- x1: 1 000 000
- w: (1200 - 600) / (2 000 000 - 1 000 000)
- Calculated: 0.0006
Making Predictions
Using our bias and calculated weight, we could now use our formula fw, b(x) = wx + b to predict how large a city might be if it had a population of 3 000 000.
- w: 0.0006
- b: 0
- x: 3 000 000
- fw, b(x): (0.0006 * 3 000 000) + 0
- Calculated: 1 800
A city with a population of 3 000 000 would have a predicted value of 1 800. "But wait a minute Gavin, 6m2 per person doesn't seem very accurate." and you're absolutely right. The issue with our current model is that it doesn't minimize the cost. In other words, our w and b values are off and as a result, our model isn't as accurate as possible to the data. The values have just been arbitrarily chosen rather than mathematically and in order to minimize our cost, we need to use gradient descent and cost functions but those are entire posts of their own. For example though, another potentially accurate model may be represented by this graph instead.
For this talk, there isn't exactly a whole lot of code to show as it's just a formula, however I would recommend checking out this interactive exercise that google has here which better shows how you can alter the bias (b) and weight (w) parameters. Furthermore it also shows loss (cost) which you can try to minimize by manipulating your weight (w) and bias (b).
If you do however want to try other values for x, here's a small code snippet.
- Python
    # Example of calculating fw,b(x) = wx + b
    w = 0.0006
    b = 0
    x = 3_000_000
    f_x = (w * x) + b